Your SEO campaign includes weekly reports that let you know exactly how well your search engine advertising campaign is performing. All of the data on our reports is sourced through third party web analytics providers, ensuring you receive reports with the highest level of accuracy and transparency. Everything in the “Keyword Ranking” section is pulled from Advanced Web Ranking, a premier SEO software provider. Our “Analytics Dashboard” is pulled directly from Google Analytics, the industry standard for website traffic monitoring.
The following information explains how to read your weekly report. Please let us know if you have any questions about the information below.
Keyword Ranking
(What you see when you first open the report):
This heading at the top indicates the search engine and location we are checking results from:

Note: Google modifies search results by location, even when the name of your town/city isn’t specified in the search term. For example, typing in “pizza” will return a list of pizzerias near you. If you search from somewhere even a few miles away, the results will be different. For the sake of monitoring your campaign progress with the least amount of bias, our software simulates a “clean slate” search from the center of the city specified. If you’ve previously visited your website and/or a competitor website, that can also have an impact on what order Google chooses to display results.
The list of phrases on the left is the selection of keywords that the software is searching for and the numbers on the right are the organic rankings for those phrases. Next to the ranking will be a symbol representing the change compared to the previous update. “Ranking” refers to the position in which your site is found below the paid ads, not the page number.
For example, the following value would mean that your website is the first blue link below the paid ads for the specified search keyword, and has moved up 50 or more positions since rankings were last checked:

Please keep in mind: As your SEO campaign progresses, you will see changes in rank as illustrated by up and down arrows and a number value. The number value indicates how many positions a keyword moved up or down.
In addition, the keywords on your report are meant to serve as indicators of how well the campaign is performing, but the list is far from all-inclusive of the benefits of SEO or our overall strategy. Even a single keyword on your report might be searched by consumers in 100 different variations. We track the most important keywords that are consistently searched, but the type of SEO we perform helps you rank for close semantic relatives of those phrases as well. Our average SEO report has under 100 keywords, while most of our clients are displayed in Google search results for well over 1,000 unique phrases each month.
Analytics Dashboard
(Accessed by clicking on “Analytics Dashboard” on the left side [desktop] or at the top [mobile phone])
If you’ve made it to the right place, you’ll find a graphic similar to this:
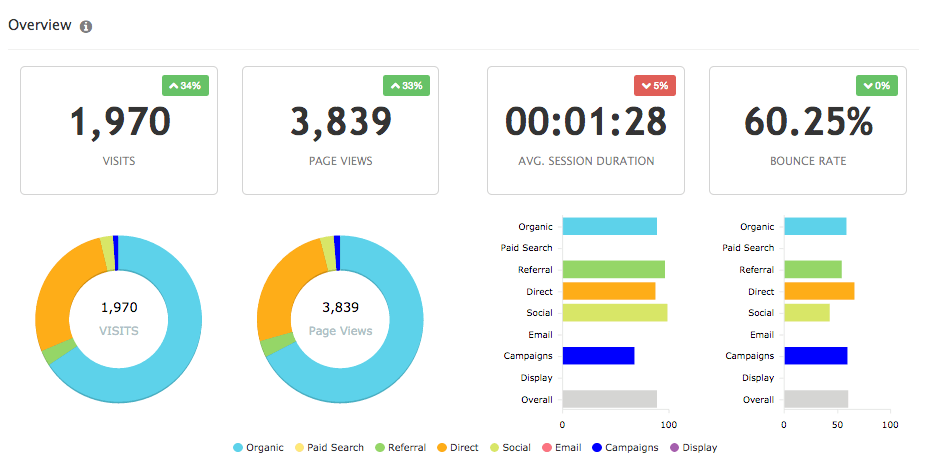
Types of Visitors:
We’ve color coded the visitor types to match the report to help make it easier to understand.
Organic – Visitor came from a Google search, Yahoo search, or Bing search; a result of search engine optimization (SEO) efforts.
Referral – Visitor came from Yelp, Angies List, a manufacturer’s dealer locator, or other website . Some of this happens naturally and some of it is from search engine optimization (SEO).
Social – Visitor came from a social media site like Facebook, Twitter, or YouTube. Some of this happens naturally and some of it may be from our marketing efforts.
Paid Search – If you have a PPC campaign (buying clicks in the ad section of Google, Yahoo, Bing, etc), you will see those visits displayed here.
Direct – This means that someone went directly to your website via your domain. They typed in www.your-website.com/ or clicked on the URL below a Google Map listing. Some of these visits may have come from our efforts (e.g. Google map rankings) and many of them will be consumers who know your brand or saw a billboard, phonebook ad, or other non-digital advertisement.
Email – If you have email blasts going out with a tracking URL, it will show up in this category.
Campaigns – If you are tracking a radio ad or some other type of special campaign with a special URL, it will show up here.
Display – If we are doing image advertising along the sides of news websites and blogs, it will register as “display.”
Behavior:
Visits – The total number of different people who visited your website in the last 30 days. Note that these are compared month over month, so seasonality will play a big factor in the up/down indicator.
Page Views – The total number of times one of your pages was looked at in the last 30 days; a valuable metric for measuring user engagement. For example, if you had 100 visitors and 200 page views, the average person looked at your home page and one other page like “contact us.”
Avg Session Duration – The average amount of time each person spends on your site. Anything above a minute is really good!
Bounce Rate – The percentage of single-page sessions (i.e. sessions in which the person left your site from the entrance page without interacting with the page). For example, users might leave your site from the entrance page if there are site design or usability issues. Alternatively, users might also leave the site after viewing a single page if they’ve found the information they need on that one page, and had no need or interest in going to other pages.
Other Features:
1. Click this button in the Analytics Dashboard to show data only for one source:

2. Hover over a pie chart to see totals
3. Hover over the line graph to see daily stats